3.4 Logging
In this lab we will install and configure the logging stack.
Task 3.4.1 Install cluster logging
You can install OpenShift Logging to aggregate all the logs from your OpenShift cluster, such as node logs, application logs and infrastructure logs.
To deploy the cluster logging stack from the CLI, we need to create the following objects. Have a look at them first:
- OpenShift Elasticsearch Operator Namespace
apiVersion: v1
kind: Namespace
metadata:
  name: openshift-operators-redhat
  annotations:
    openshift.io/node-selector: ""
  labels:
    openshift.io/cluster-monitoring: "true"
- Red Hat OpenShift Logging Namespace
apiVersion: v1
kind: Namespace
metadata:
  name: openshift-logging
  annotations:
    openshift.io/node-selector: ""
  labels:
    openshift.io/cluster-monitoring: "true"
- OpenShift Elasticsearch Operator
OperatorGroup
apiVersion: operators.coreos.com/v1
kind: OperatorGroup
metadata:
  name: openshift-operators-redhat
  namespace: openshift-operators-redhat
spec: {}
- Red Hat OpenShift Logging
OperatorGroup
apiVersion: operators.coreos.com/v1
kind: OperatorGroup
metadata:
  name: cluster-logging
  namespace: openshift-logging
spec:
  targetNamespaces:
  - openshift-logging
- OpenShift Elasticsearch Operator
Subscription
apiVersion: operators.coreos.com/v1alpha1
kind: Subscription
metadata:
  name: "elasticsearch-operator"
  namespace: "openshift-operators-redhat"
spec:
  channel: "stable"
  installPlanApproval: "Automatic"
  source: "redhat-operators"
  sourceNamespace: "openshift-marketplace"
  name: "elasticsearch-operator"
- Red Hat OpenShift Logging
Subscription
apiVersion: operators.coreos.com/v1alpha1
kind: Subscription
metadata:
  name: cluster-logging
  namespace: openshift-logging
spec:
  channel: "stable"
  name: cluster-logging
  source: redhat-operators
  sourceNamespace: openshift-marketplace
Now either copy and paste above resource definitions and then apply them to your cluster or directly use our provided files:
oc apply -f https://raw.githubusercontent.com/acend/openshift-operations-training/main/content/en/docs/03/resources/logging/ns_openshift-operators-redhat.yaml
oc apply -f https://raw.githubusercontent.com/acend/openshift-operations-training/main/content/en/docs/03/resources/logging/ns_openshift-logging.yaml
oc apply -f https://raw.githubusercontent.com/acend/openshift-operations-training/main/content/en/docs/03/resources/logging/og_openshift-operators-redhat.yaml
oc apply -f https://raw.githubusercontent.com/acend/openshift-operations-training/main/content/en/docs/03/resources/logging/og_cluster-logging.yaml
oc apply -f https://raw.githubusercontent.com/acend/openshift-operations-training/main/content/en/docs/03/resources/logging/sub_elasticsearch-operator.yaml
oc apply -f https://raw.githubusercontent.com/acend/openshift-operations-training/main/content/en/docs/03/resources/logging/sub_cluster-logging.yaml
Verify if the Elasticsearch Operator installation succeeded.
In order to find that out, check for the resource clusterserviceversion (or csv for short) in all namespaces.
Hints
oc get csv --all-namespaces
Example output:
NAMESPACE                                 NAME                              DISPLAY                            VERSION    REPLACES   PHASE
default                                   elasticsearch-operator.5.1.2-7    OpenShift Elasticsearch Operator   5.1.2-7               Succeeded
kube-node-lease                           elasticsearch-operator.5.1.2-7    OpenShift Elasticsearch Operator   5.1.2-7               Succeeded
kube-public                               elasticsearch-operator.5.1.2-7    OpenShift Elasticsearch Operator   5.1.2-7               Succeeded
kube-system                               elasticsearch-operator.5.1.2-7    OpenShift Elasticsearch Operator   5.1.2-7               Succeeded
openshift-apiserver-operator              elasticsearch-operator.5.1.2-7    OpenShift Elasticsearch Operator   5.1.2-7               Succeeded
openshift-apiserver                       elasticsearch-operator.5.1.2-7    OpenShift Elasticsearch Operator   5.1.2-7               Succeeded
openshift-authentication-operator         elasticsearch-operator.5.1.2-7    OpenShift Elasticsearch Operator   5.1.2-7               Succeeded
openshift-authentication                  elasticsearch-operator.5.1.2-7    OpenShift Elasticsearch Operator   5.1.2-7               Succeeded
...
There should be an OpenShift Elasticsearch Operator in each namespace. The version number might be different than shown.
Verify the Cluster Logging Operator installation, this time by checking for clusterserviceversions inside the openshift-logging namespace.
Hints
oc get csv -n openshift-logging
Example output:
NAME                      DISPLAY                     VERSION   REPLACES                   PHASE
...
cluster-logging.5.1.2-7   Red Hat OpenShift Logging   5.1.2-7   cluster-logging.5.1.1-36   Succeeded
...
There should be a Cluster Logging Operator in the openshift-logging namespace. The version number might be different than shown.
Now you can create an OpenShift Logging instance.
Note
Note the already baked-in tolerations.The logging instance definition looks as follows:
apiVersion: "logging.openshift.io/v1"
kind: "ClusterLogging"
metadata:
  name: "instance"
  namespace: "openshift-logging"
spec:
  managementState: "Managed"
  logStore:
    type: "elasticsearch"
    elasticsearch:
      nodeCount: 3
      storage:
        size: 50G
      resources:
        requests:
          memory: "8Gi"
      proxy:
        resources:
          limits:
            memory: 256Mi
          requests:
             memory: 256Mi
      redundancyPolicy: "SingleRedundancy"
      tolerations:
      - effect: NoSchedule
        key: node-role.kubernetes.io/infra
    retentionPolicy:
      application:
        maxAge: 1d
      infra:
        maxAge: 1d
      audit:
        maxAge: 1d
  visualization:
    type: "kibana"
    kibana:
      replicas: 1
      tolerations:
      - effect: NoSchedule
        key: node-role.kubernetes.io/infra
  collection:
    logs:
      type: "fluentd"
      fluentd:
        tolerations:
        - effect: NoSchedule
          key: node-role.kubernetes.io/infra
Again, you can use the provided file or put above content in a file of your own:
oc apply -f https://raw.githubusercontent.com/acend/openshift-operations-training/main/content/en/docs/03/resources/logging/clusterlogging_instance.yaml
Note
The provided configuration is a basic setup that should support most use cases. For details on how to configure the logging stack, consult the chapter About the Cluster Logging custom resource in the official documentation.Verify the installation by listing the pods in the openshift-logging project.
You should see several pods for OpenShift Logging, Elasticsearch, Fluentd, and Kibana.
Hints
oc get pods -n openshift-logging
Example output:
NAME                                            READY   STATUS    RESTARTS   AGE
cluster-logging-operator-664b7f76d8-v65hn       1/1     Running   0          12d
collector-74jkk                                 2/2     Running   0          12d
collector-g2djj                                 2/2     Running   0          12d
collector-gzrt5                                 2/2     Running   0          12d
collector-j2q86                                 2/2     Running   0          12d
collector-nkngv                                 2/2     Running   0          12d
collector-pbvhn                                 2/2     Running   0          12d
elasticsearch-cdm-0w2i8ldc-1-58b948bd84-cc7t2   2/2     Running   0          12d
elasticsearch-cdm-0w2i8ldc-2-7b6989ddb7-c78tg   2/2     Running   0          12d
elasticsearch-cdm-0w2i8ldc-3-64b5f55f58-9455z   2/2     Running   0          12d
kibana-687fdb6fb5-64jpw                         2/2     Running   0          12d
Task 3.4.2 Enable audit log forwarding
By default, the logging stack does not store the audit logs in Elasticsearch, since Elasticsearch does not provide encryption.
For the purpose of this lab you will configure the logging stack to store the audit logs in the central Elasticsearch cluster.
We can make use of the cluster log forwarding feature of the OpenShift Logging stack, which allows us to route logs to different log stores by defining forwarding pipelines.
Note
Because we do not have an external log store to forward our logs to, we will make use of the cluster-internal Elasticsearch instance. Check the documentation on Forwarding logs to third party systems to learn more about the supported third-party log stores.To forward the audit logs to the internal Elasticsearch instance, we need to define a ClusterLogForwarder object:
apiVersion: logging.openshift.io/v1
kind: ClusterLogForwarder
metadata:
  name: instance
  namespace: openshift-logging
spec:
  pipelines:
  - name: audit-default
    inputRefs:
    - audit
    outputRefs:
    - default
  - name: infrastructure-default
    inputRefs:
    - infrastructure
    outputRefs:
    - default
  - name: application-default
    inputRefs:
    - application
    outputRefs:
    - default
You can also use our provided file:
oc apply -f https://raw.githubusercontent.com/acend/openshift-operations-training/main/content/en/docs/03/resources/logging/clusterlogforwarder_instance.yaml
Task 3.4.3 Configure and use Kibana
Now that you have installed and confugred the logging stack, it is time to check the log visualizer - Kibana.
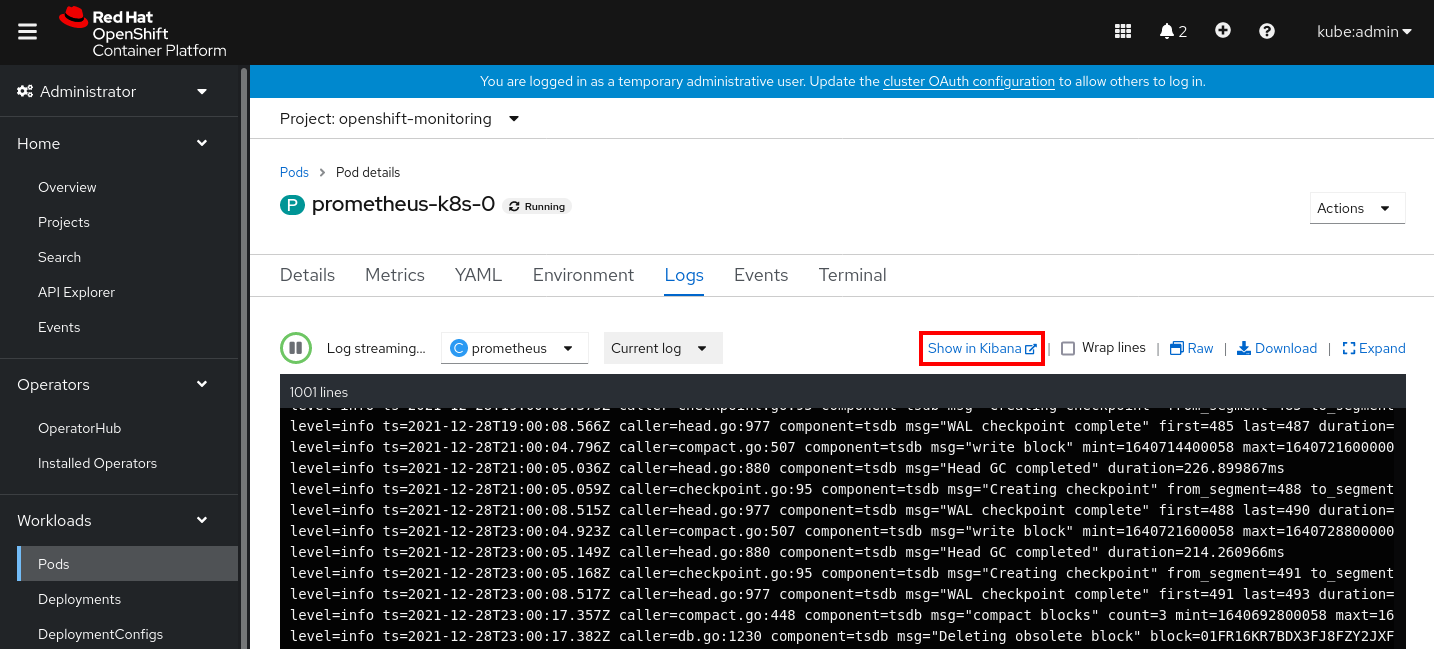
To get to Kibana you can either click the Application Launcher  and select Logging, or by clicking on Show in Kibana in the log browser of the console:
The log store of the logging stack (Elasticsearch) stores the logs in three index categories: Application, Infrastructure and, if enabled, Audit.
The first time you log in to Kibana, you need to create index patterns for your user:
- Create the infra index pattern:
- Define the infra index pattern
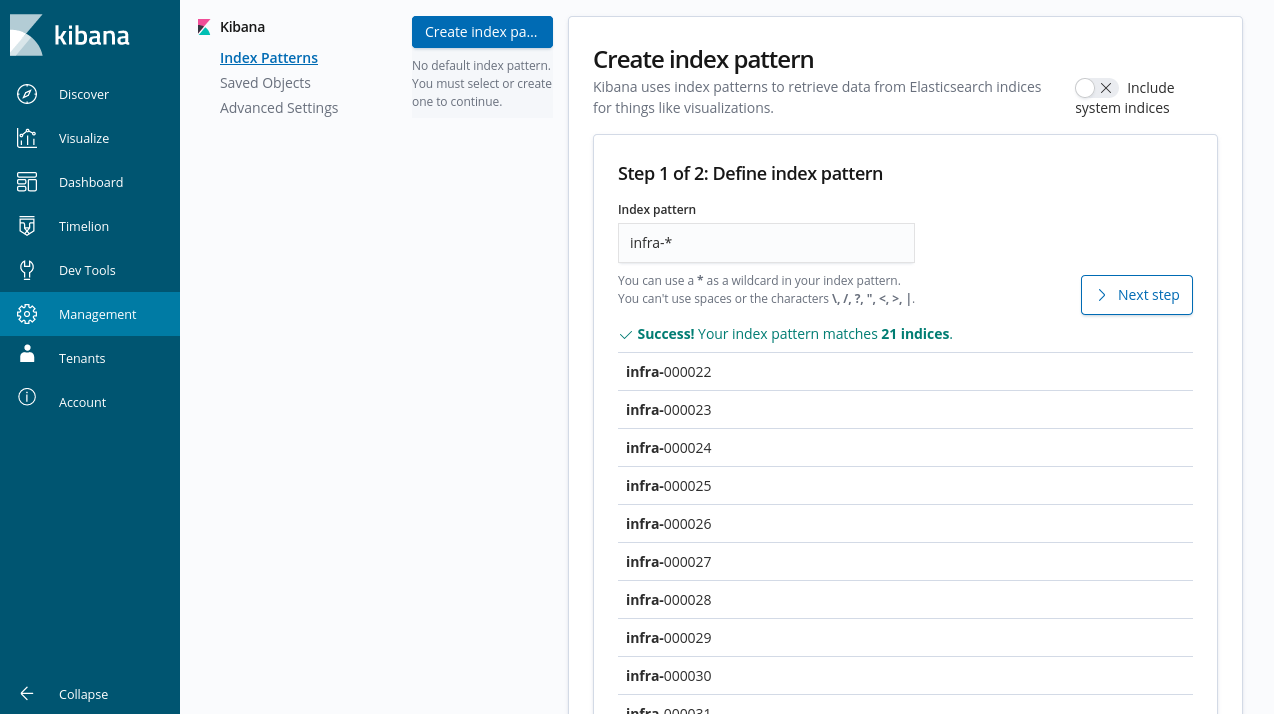
- Select
@timestampas the filed name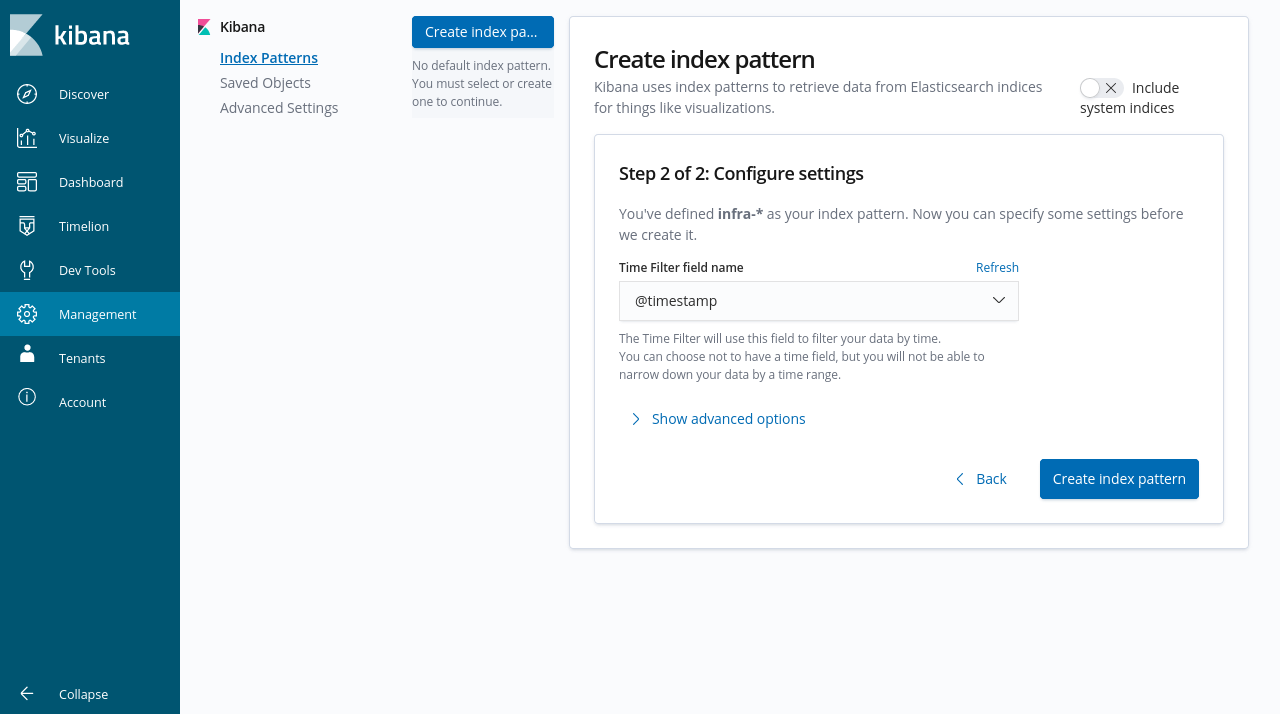
- Define the infra index pattern
- Repeat these steps for the remaining indices (audit, apps)
- Go to Discover to see the logs
The following screenshot shows the logs of the infra index for the pods in the namespace openshift-kube-apiserver for the last 12 hours:
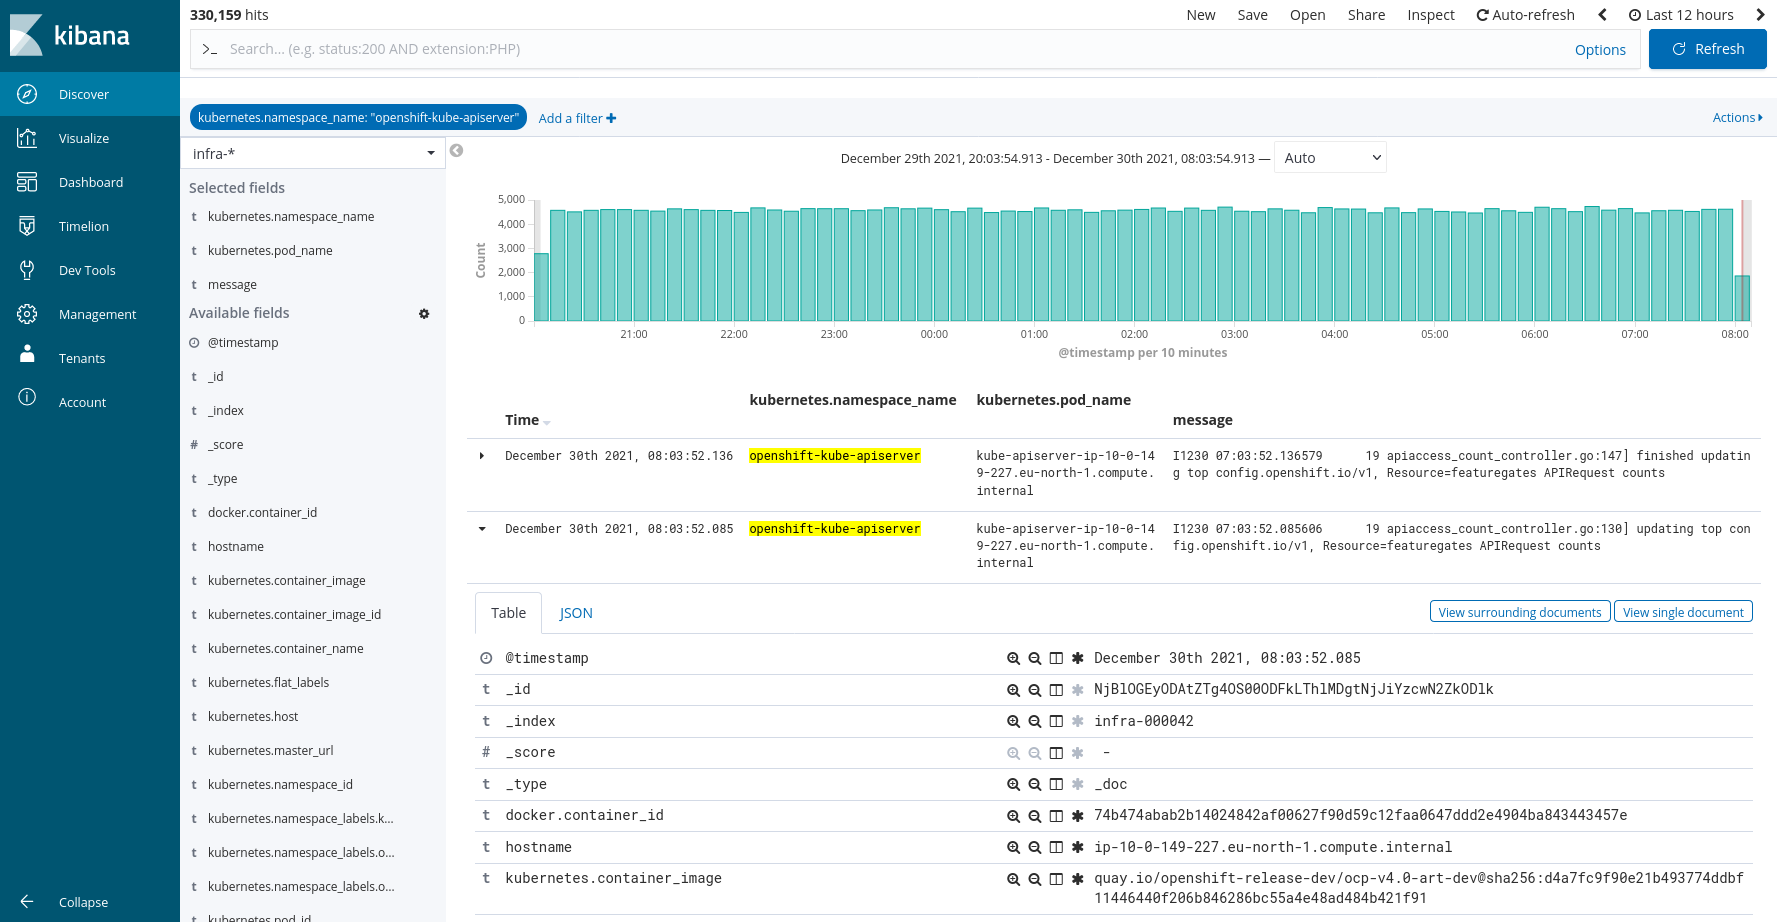
Try to see the same logs on your cluster by exploring the features of Kibana.